Welcome to IELTS Productive
IELTS Task 1
This is a lesson to help you understand task 1 and improve your writing.
How to use this lesson:
- Study the useful language
- Do the practice
- Use the useful language to write the task
- Get feedback
- Repeat the task using the feedback to improve your writing
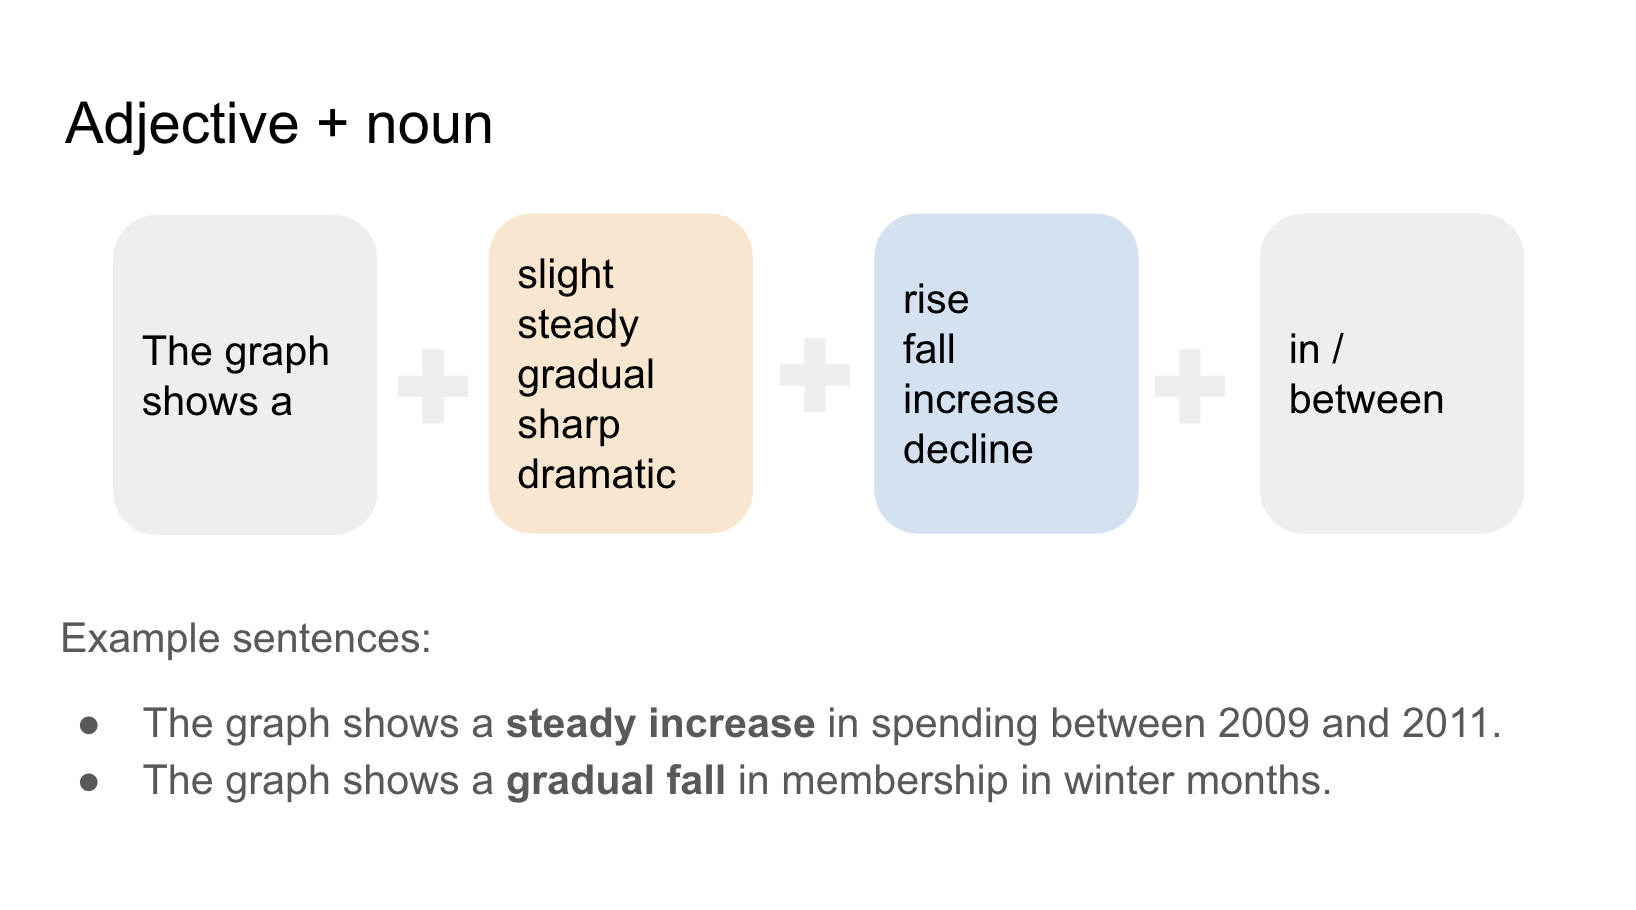
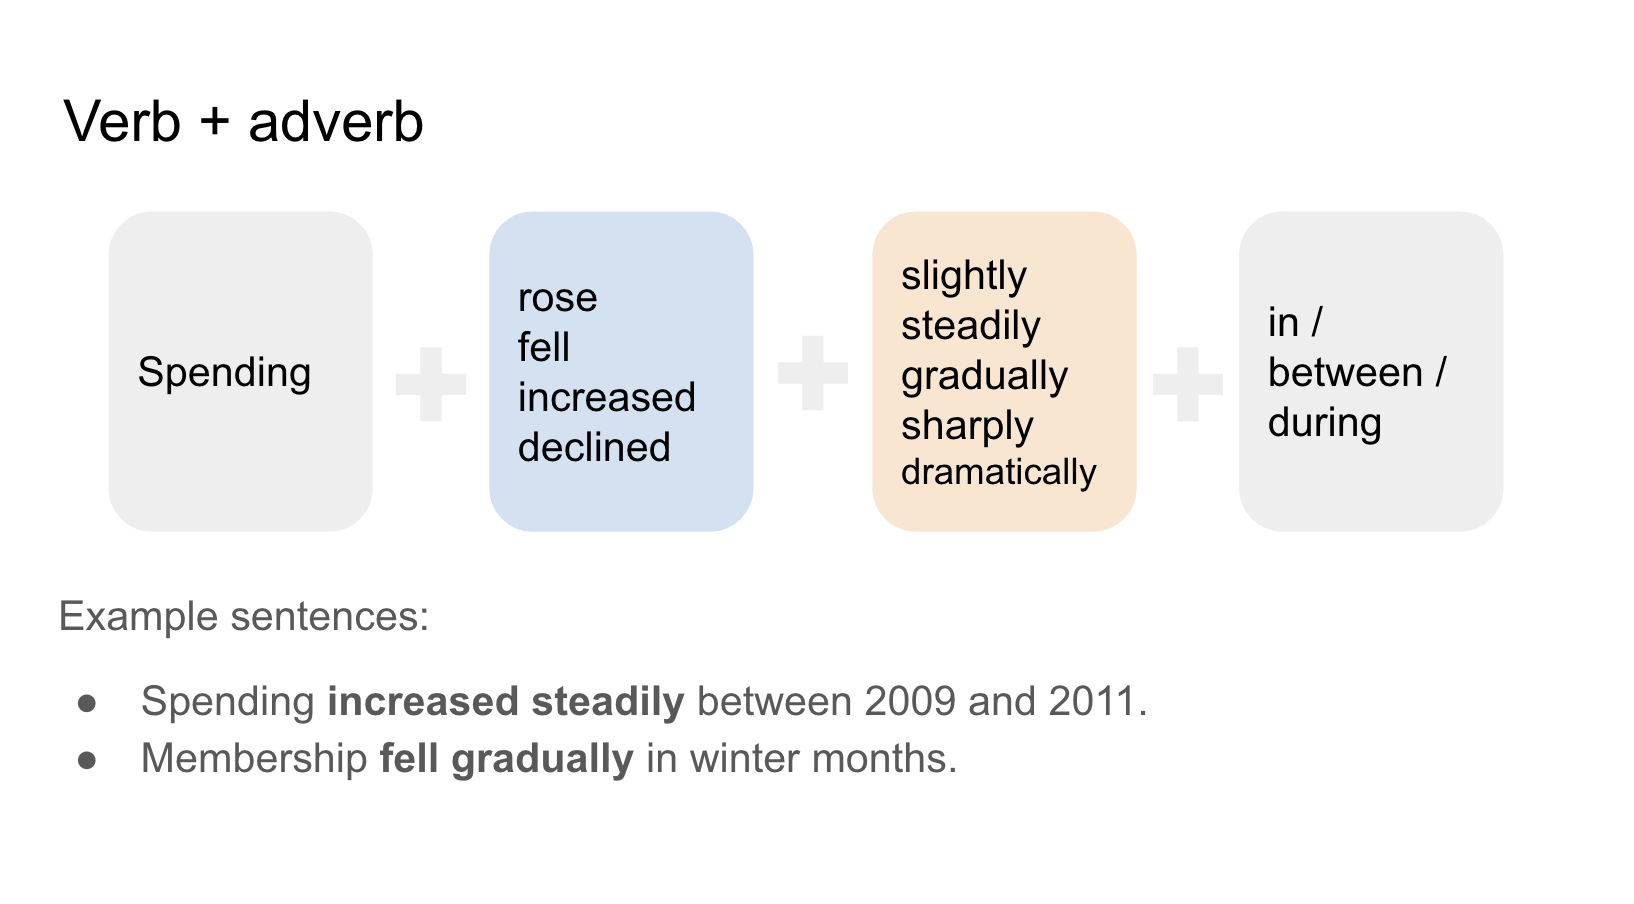
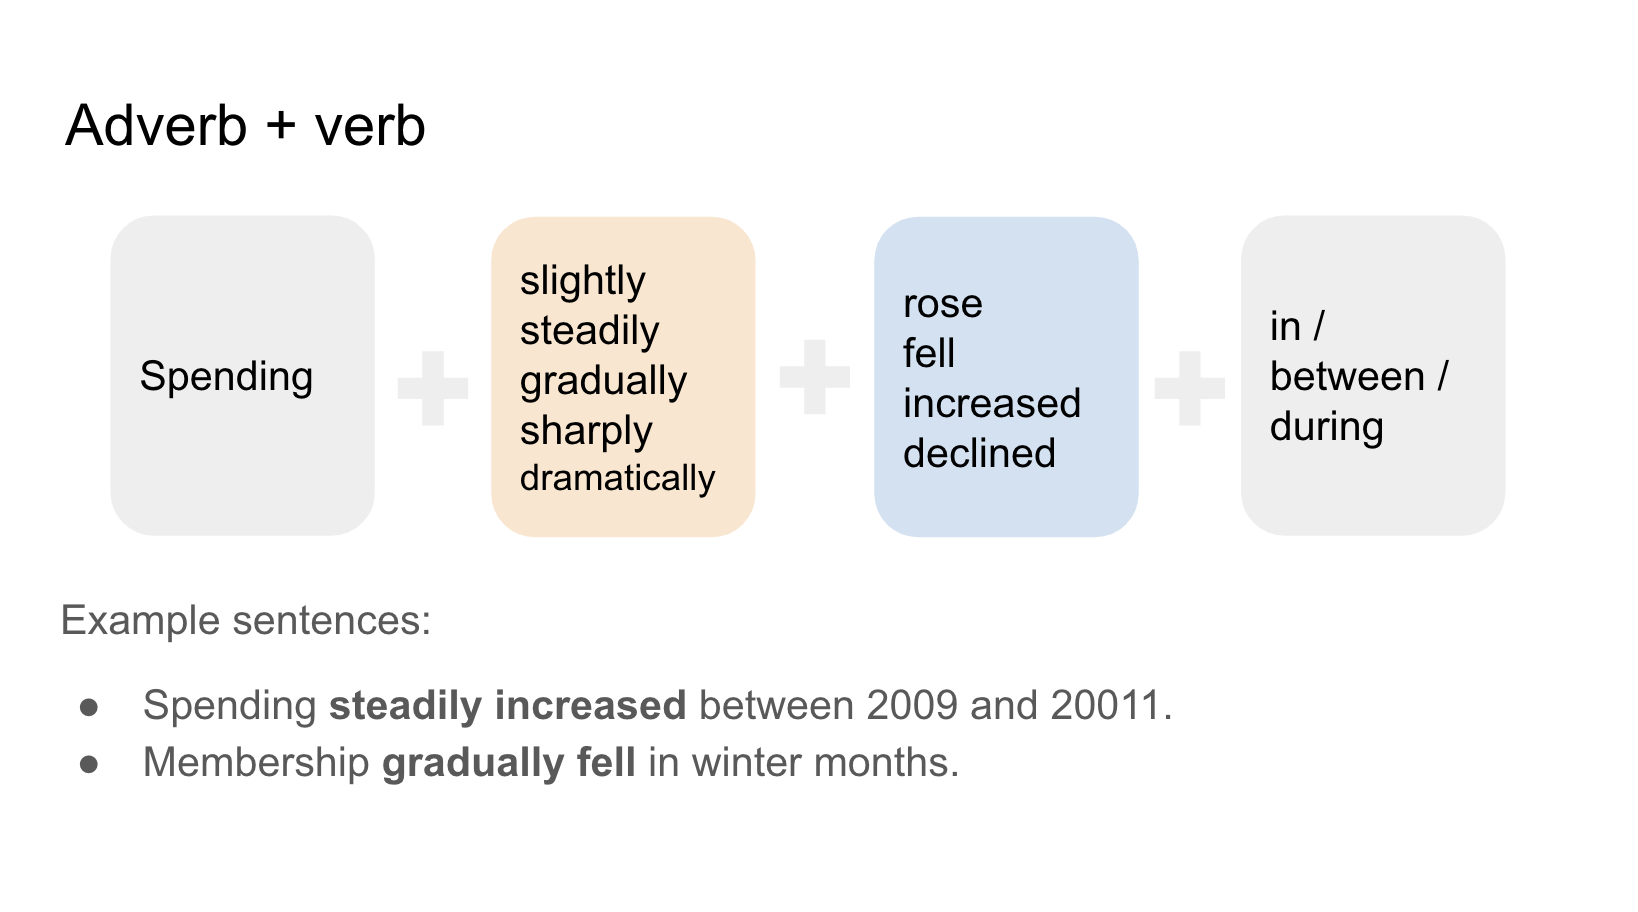
📚 Useful Language
🎯 IELTS Task 1 Practice
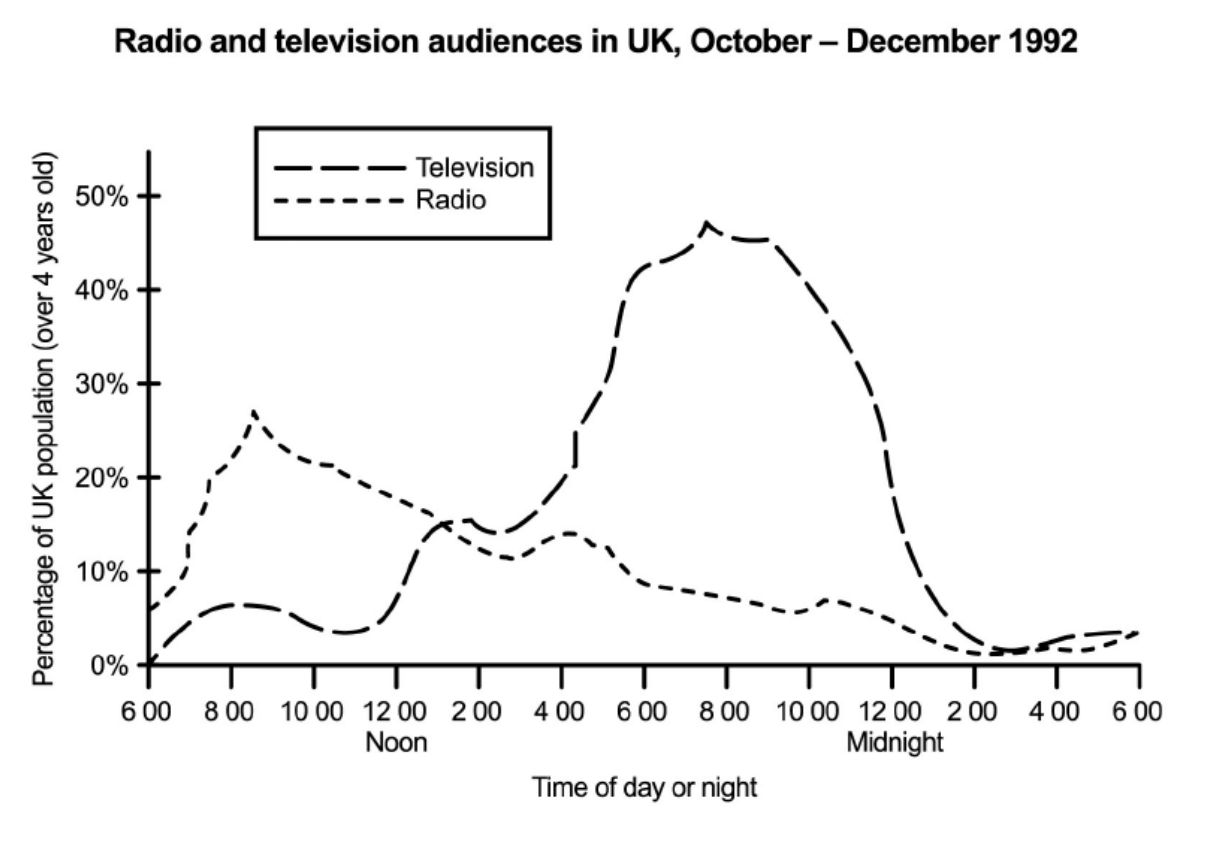
1. Read the graph
2. Complete the sentences to correctly describe the graph:
You can use the useful language to help you.
GREEN = Correct, RED = Incorrect
The graph shows a in television viewership from 4:00 pm to 8:00 pm.
From 8:00 pm to 10:00 pm, there was a in viewership numbers.
Between 10:00 pm and midnight, television viewership to its lowest point.
During the early morning hours, radio listenership .
At 6:00 am, there was a in radio listeners.
After the morning peak, radio listenership until noon.
From noon until 4:00 pm, television viewership .
The afternoon saw a in radio listeners.
During the evening news hour, in radio listenership.
After the evening peak, television viewership as people went to bed.
✍️ Writing Task 1
You should spend about 20 minutes on this task.
The graph below shows radio and television audiences throughout the day in 1992.
Summarise the information by selecting and reporting the main features, and make comparisons where relevant.
Write at least 150 words.